
Record Visual Defects at the Station and See Where They Keep Coming Back
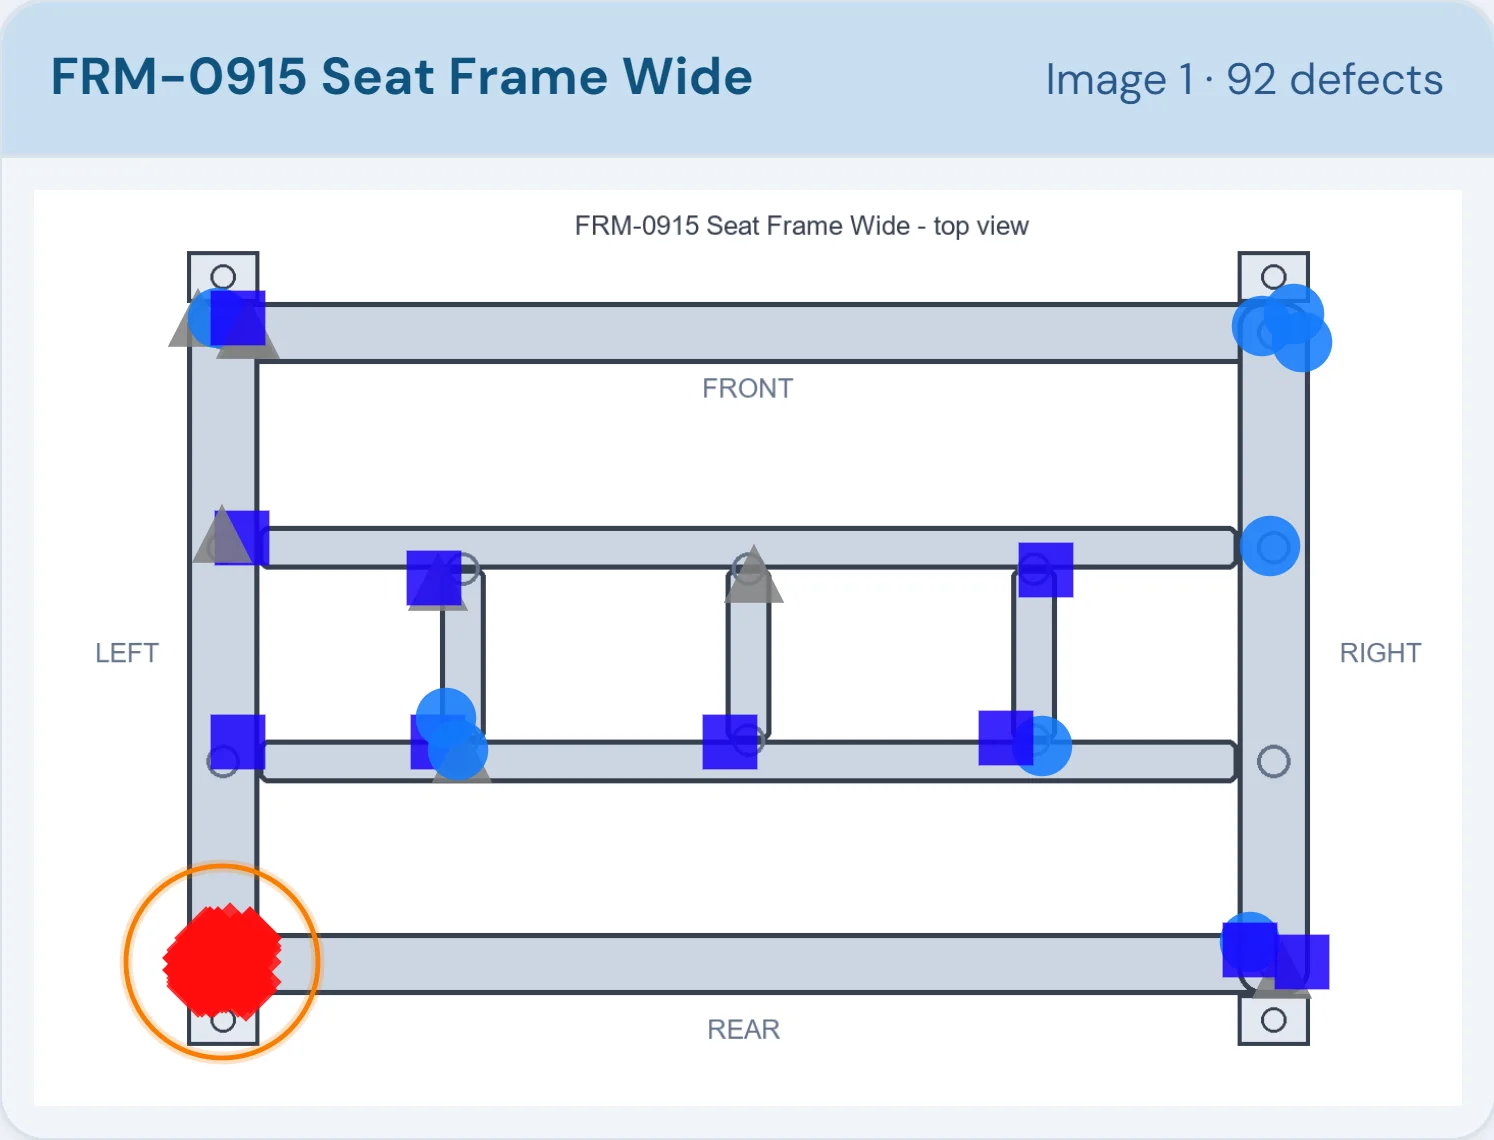
Inspectors mark each defect on an image of the part, pick its category and record repair or reject. The defect map and Pareto then show which defects recur and where on the part they appear.
The inspector knows where the scratch was. The check sheet just says "scratch".
At final inspection, the inspector sees the defect, where it sits on the part, and whether the part can be repaired. What reaches the record is often a tally mark under a broad category with no serial number attached, and the location and the repair decision are lost.
Without those details, nobody can say:
- What defects are occurring most often
- Where on the product they usually appear
- Whether the issue is concentrated on a specific component or area
- Whether it is getting better or worse over time
- Whether the defect is being repaired or driving scrap
What the inspector sees, and what gets saved
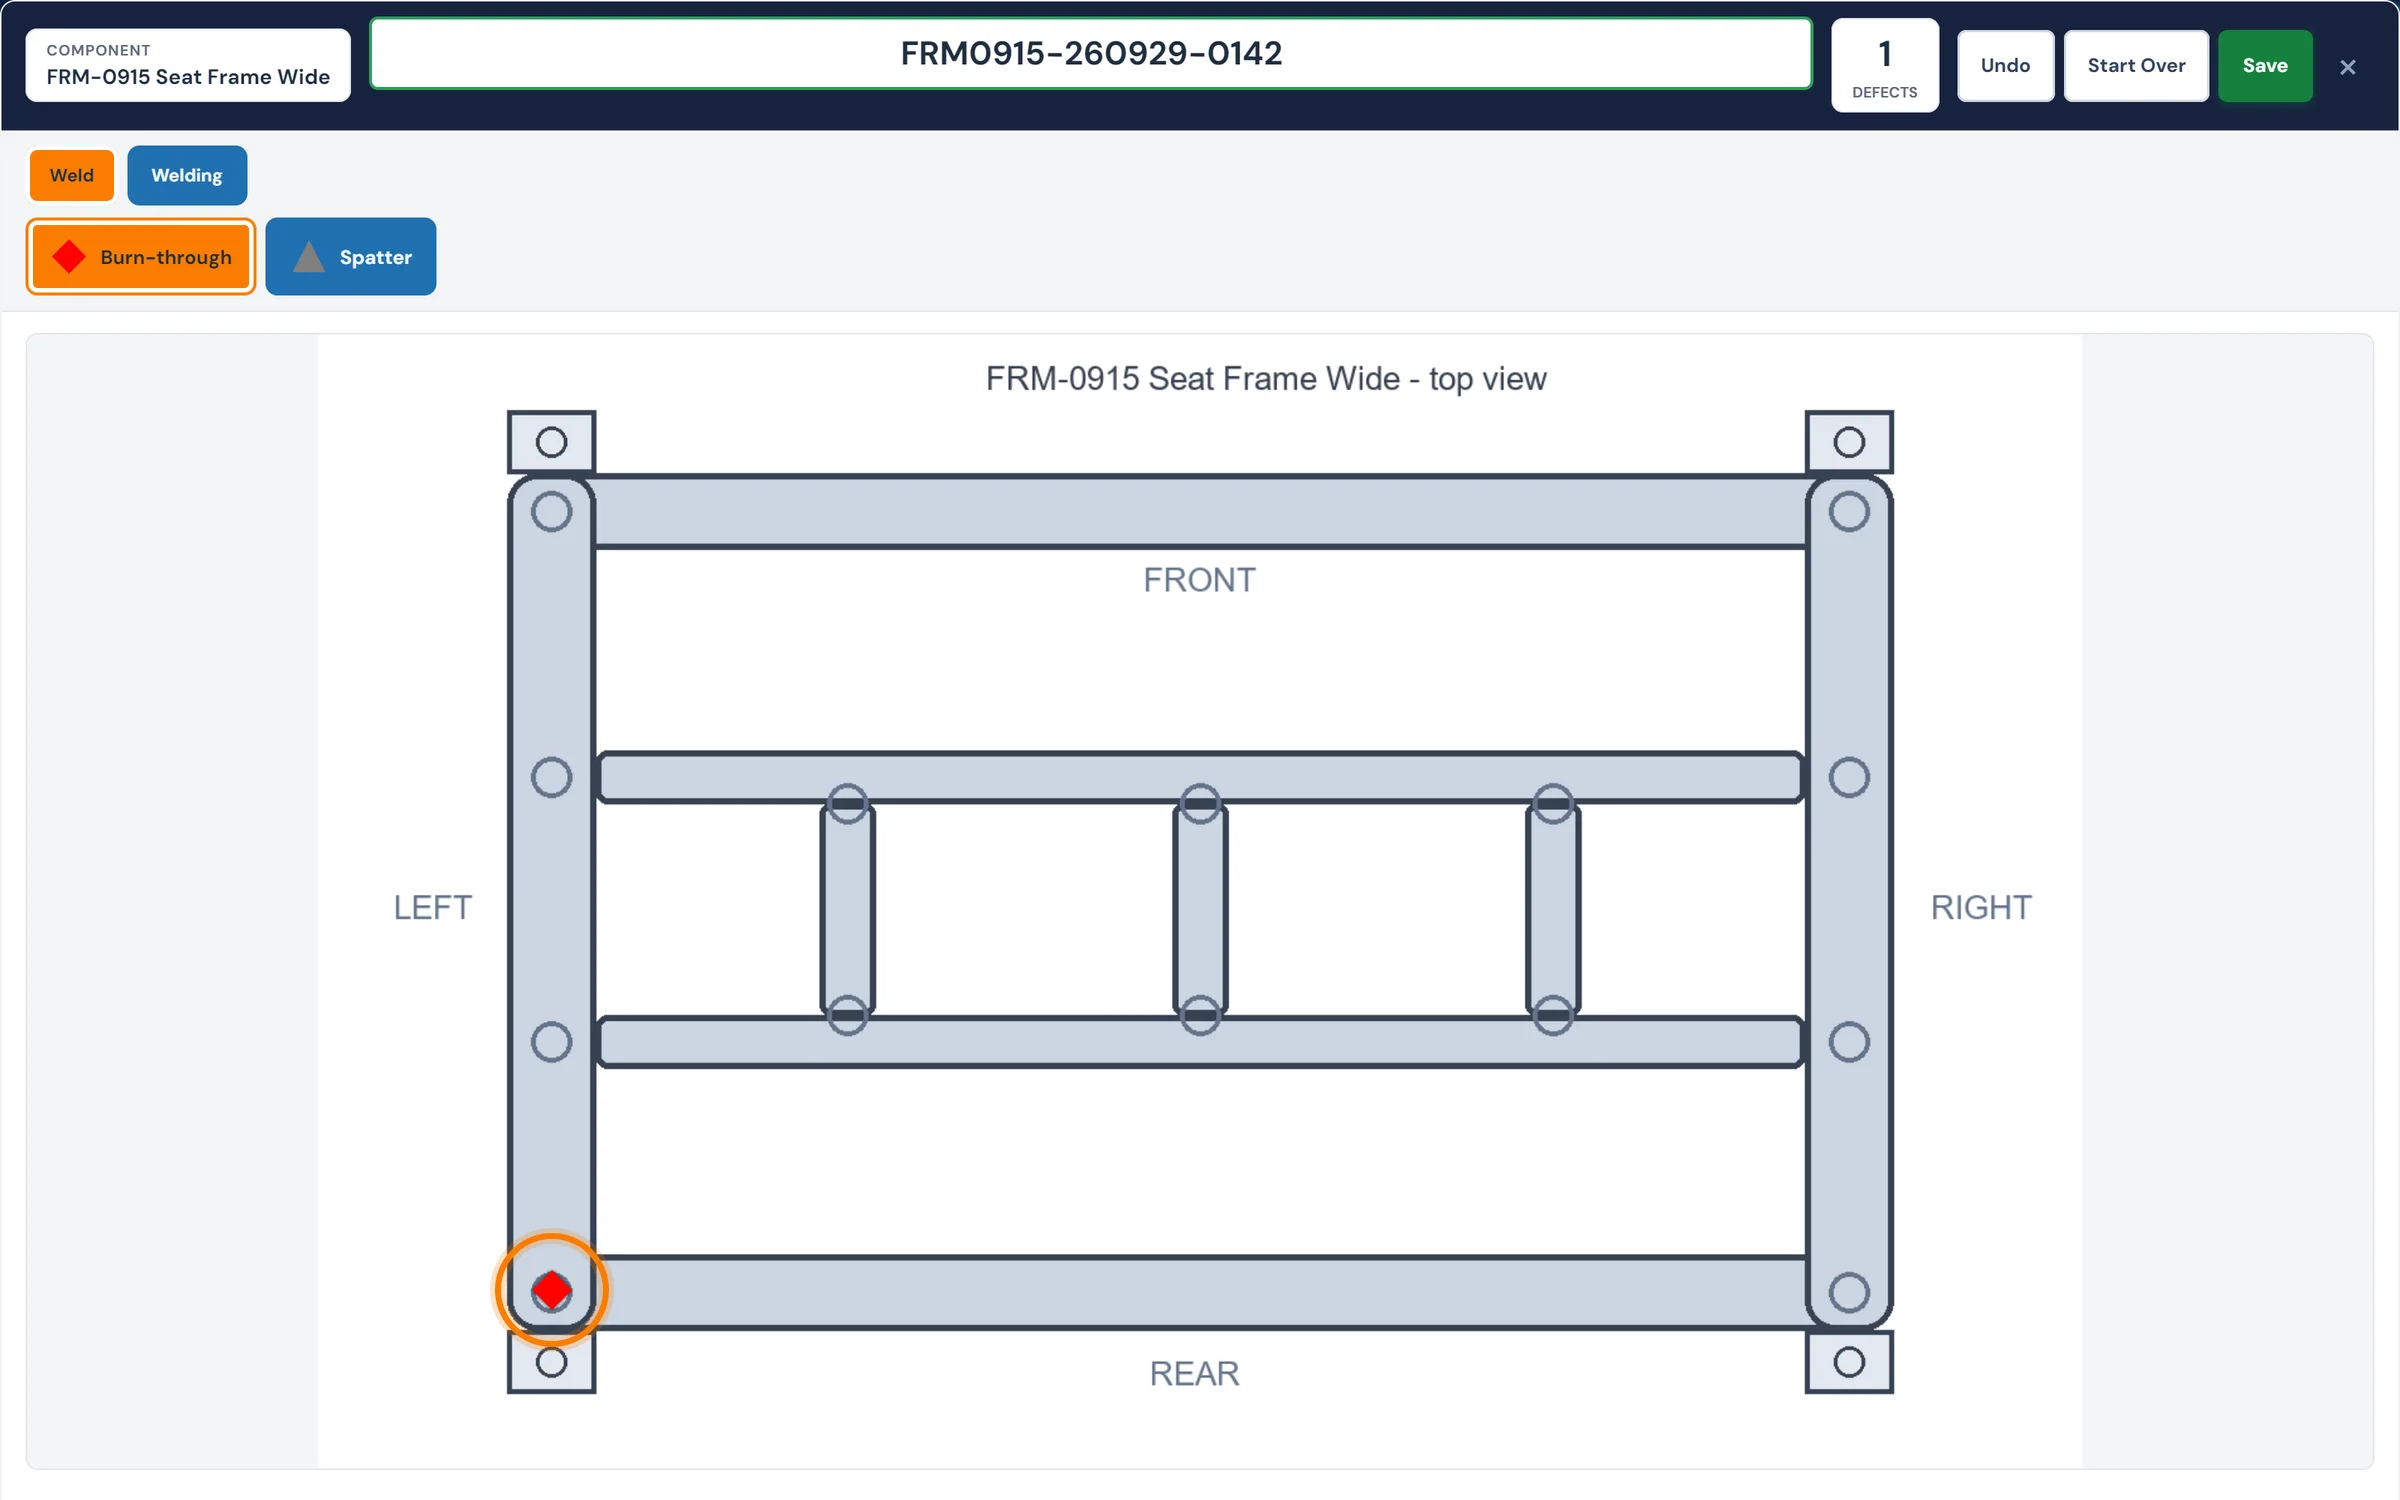
The screen at the inspection station shows the product and walks the inspector through the inspection. Each defect is recorded against the product image, with its category and a repair or reject decision.
- A product image on screen as the inspection reference
- Step-by-step guidance for the inspection sequence
- The ability to indicate exactly where the defect appears on the product
- A structured defect category list for consistent classification
- A disposition step to confirm repair or reject
- Defect type
- Defect category and sub-category
- Location of the defect on the product
- Component or sub-component affected
- Repair or reject disposition
- Serial-number level defect history
Each inspection adds points to the product's defect map, and a cluster at one joint or one corner becomes obvious as the entries build up.
What you can capture
Defect categories and sub-categories
The same defect gets the same name on every shift, so it can be counted and trended.
Defect location on the product image
The inspector taps the spot on the product image. A note saying "left side" can't be plotted; a marked position can.
Repair or reject decisions
The inspector records whether the part goes to repair or is rejected, so one entry serves both the quality analysis and the disposition.
Serial-number level defect history
Defects attach to the unit's serial number, so a later question about one unit can be answered from its own record.
Multiple product views
Top, bottom, front and side images for parts that can't be inspected from a single angle.
Component and sub-component defects
Record the component or subassembly affected when the defect belongs to one part of the finished unit.
Reports built from the entries:
- A Pareto of defect types, ranked by how often they occur and how much impact they have
- Defect frequency and type by line, shift, product or operator, over time
Where defects cluster on the part
The scatter plot puts every recorded defect on the product image. When the same defect keeps landing in the same area, it shows as a cluster, and the discussion moves to the process step, fixture, handling or material behind it. It matters most on appearance-critical parts, such as in automotive.
Why "where" matters as much as "what"
One month of final inspection on a moulded housing: 120 defects. Recorded by type alone, scratches top the list and get blamed on handling. Recorded with location, most of the list points somewhere specific. Illustrative numbers.
| Defect | Count | Where they fall on the part | What the location points to |
|---|---|---|---|
| Scratch | 46 | 31 on the top face near the same corner; the rest scattered | A fixed contact point, such as a transfer guide or fixture edge, not general handling |
| Sink mark | 28 | Almost all over the two thick mounting bosses | Wall thickness and packing: a process or tooling question |
| Short fill | 18 | The far end of the part, away from the gate | Fill and venting at the end of flow |
| Flash | 16 | Along the parting line on one side only | Wear or clamping on one half of the tool |
| Contamination | 12 | Anywhere | Location doesn't help here; the material lot and dryer records do |
What changed: without location, the team would retrain operators on handling. With it, two-thirds of the scratches trace to one contact point that can be fixed once, and the sink marks and flash go to process and tooling instead of to inspection. That's the same data an inspector already sees, captured with one extra tap.
Making visual inspection consistent
- Define every defect with a picture and a limit. "Scratch" isn't a standard; "scratch longer than 5 mm on a Class A surface" is.
- Keep limit samples at the station. A small defect kit of just-acceptable and just-rejectable parts settles most arguments.
- Keep the category list short and per product. Long lists make inspectors pick whatever is close.
- Make disposition rules explicit. Which defects can be repaired, and which are always scrap.
- Check inspectors against each other. A periodic attribute agreement study shows who is calling it differently.
What a useful inspection record holds
- Product, and serial number where parts are serialized
- Defect category and sub-category
- Where on the part, marked on an image of the product
- Disposition: pass, repair or reject
- Inspector, station and time
With those five things, the Pareto shows what to work on, the location plot shows where to look, and the serial history answers customer questions later. See Track & Trace for the serial side.
Modules that share the inspection data
Visual Inspection questions
- What is visual inspection in manufacturing?
- Visual inspection is checking parts by eye, sometimes with magnification or lighting aids, for defects such as scratches, dents, contamination, missing features or poor finish. It is usually the final gate before shipping and often the only check for cosmetic defects. It is only as good as its consistency: clear defect definitions, limit samples and a record of what was found and where.
- How do you make visual inspection more consistent between inspectors?
- Define every defect with a picture and an accept/reject limit, keep limit samples (a defect kit) at the station, keep the category list short and specific to the product, make repair-versus-reject rules explicit, and check inspectors against each other periodically with an attribute agreement study. Recording where each defect appears also makes differences between inspectors visible.
- What does the inspector see on screen?
- The inspector sees an image of the product and marks where the defect is on it. Step-by-step guidance and any reference information for the inspection are shown alongside.
- Can defects be categorized?
- Yes. Visual defects can be organized into categories and sub-categories, so the same defect is reported under the same name from shift to shift.
- Can we track defects by serial number?
- Yes. Defects can be recorded and reported by serial number, linking each defect to that unit's product record.
- Can the system support different product views?
- Yes. When one angle isn't enough for the part's shape or the inspection, the product can be shown from several views, such as top, bottom, front or side.
- Can inspectors decide repair versus reject in the workflow?
- Yes. The inspection workflow can include a disposition step where the inspector records whether the product can be repaired or must be rejected.
- How does the reporting help root-cause analysis?
- Because location is recorded along with defect type, defects can be shown as a scatter plot on the product image. Clusters that a count by type would hide become visible, and each cluster gives the investigation a specific place on the part to start.
Set up around how your plant runs
Standardized platforms expect the plant to change to fit the software. Do-it-yourself platforms leave your team to build and maintain everything. With 10in6, we configure the system around your equipment, codes and reports, and your team runs it day to day.
Your equipment, codes and reports
Your checks, intervals and forms set up per line and product, and traceability built around your part numbers and your customers’ requirements.
Your team runs it day to day
Operators, downtime and scrap codes, products and targets, shift schedules, checks, alerts, emailed reports and real-time boards are managed by your own people. Everyday changes need no support ticket and no invoice.
A project manager for the bigger things
New machines, new modules and custom reports go through a 10in6 project manager who already knows your deployment, so nothing starts from scratch. If you would rather we made everyday changes too, we can.
Still here years later
The system keeps being refined after go-live, and new capabilities are added without rebuilding it. Some of our customer relationships have run for 12 years, and 97% of customers say they would never go back.
“Our 10in6 Project Manager has been very responsive and the software is flexible enough to be configured to our specific needs.”
How the 10in6 delivery model works →
See where your defects cluster.
Tell us what you inspect for today and how it gets recorded. We'll show you what a defect map would look like for one of your parts.