
A Production Reporting System Built on Real Shop Floor Data
Shift reports built from machine counts and operator entries at the line, and emailed when the shift ends.
Where hand-built shift reports go wrong
Production numbers often come from handwritten notes, whiteboards, end-of-shift summaries, or counts re-entered into another system later. By the time the report is ready, the shift is over and the conversation has moved from what to do to what happened.
The spreadsheet is usually fine. What feeds it is the weak point: counts copied from a machine display, downtime written on a clipboard, scrap tallied at the end of the shift. Each copy adds delay and error, each shift fills it in a little differently, and the person who maintains the workbook becomes the only one who understands it. When the numbers disagree, the production meeting turns into an argument about the data instead of a decision about the line.
Three places production reports come from
| Spreadsheets and whiteboards | ERP reports | Production reporting system | |
|---|---|---|---|
| Where the data comes from | Typed in from notes and machine displays | Transactions: orders, consumption, shipments | Machines and PLCs, plus operator context at the line |
| When it's ready | Hours or a day after the shift | When transactions are posted | As the shift runs, and emailed when it ends |
| Level of detail | Whatever someone had time to record | Order and part totals | Machine, hour, shift, product and reason |
| Explains why output was short | Rarely, and from memory | No | Yes: the downtime, speed loss and scrap behind it |
| Effort each shift | Someone builds it by hand | Low, but it answers different questions | None once it's configured |
The ERP and a production reporting system answer different questions, so plants run both. 10in6 integrates with the ERP so production actuals flow across without being typed in twice.
How 10in6 Production Reporting works
10in6 captures production data as it happens: counts, run states and cycle times from equipment and PLCs, and the context only an operator can add, such as why a machine stopped.
Every report is generated from that one record, so the shift report, the daily summary and the OEE numbers agree with each other.
What you can report on
OEE and performance reporting
OEE by machine, line and time period, with the Availability, Performance and Quality losses that explain the number.
Downtime and loss analysis
Pareto-style reports rank downtime reasons and recurring losses by the output they cost.
Scrap and quality reporting
Scrap by reason and quality losses over time, reported alongside output.
Drill-down reporting
Move from a plant-level summary down into the machine, line, shift, product, operator, or time range that needs attention.
Automated report delivery
Schedule standard reports for automatic delivery by email or within the system.
"I use the mobile views everyday. I look at them before I go to bed and after I get up. I can quickly see if reject rates are high or there is excess downtime and get in touch with the support team immediately. I don't have to come in and check my emails to see what happened on afternoon shift yesterday — I already know what happened and what we need to focus on."
— Harvey Daneluk, Production Manager, Stackpole International
"We are now data driven — not best guess driven. Before 10in6 the shift foreman used to put a line on a report about an issue, but we had no idea how big of a problem it was, how much production was lost because of it. Now we prioritize issues based on the impact on production, not how many times we hear about an issue."
— Bill Swan, Division Manager, AMPI
What a useful shift report shows
A shift report is read in the two minutes before the next shift's huddle. It should answer one question: what does the next shift need to watch or fix?
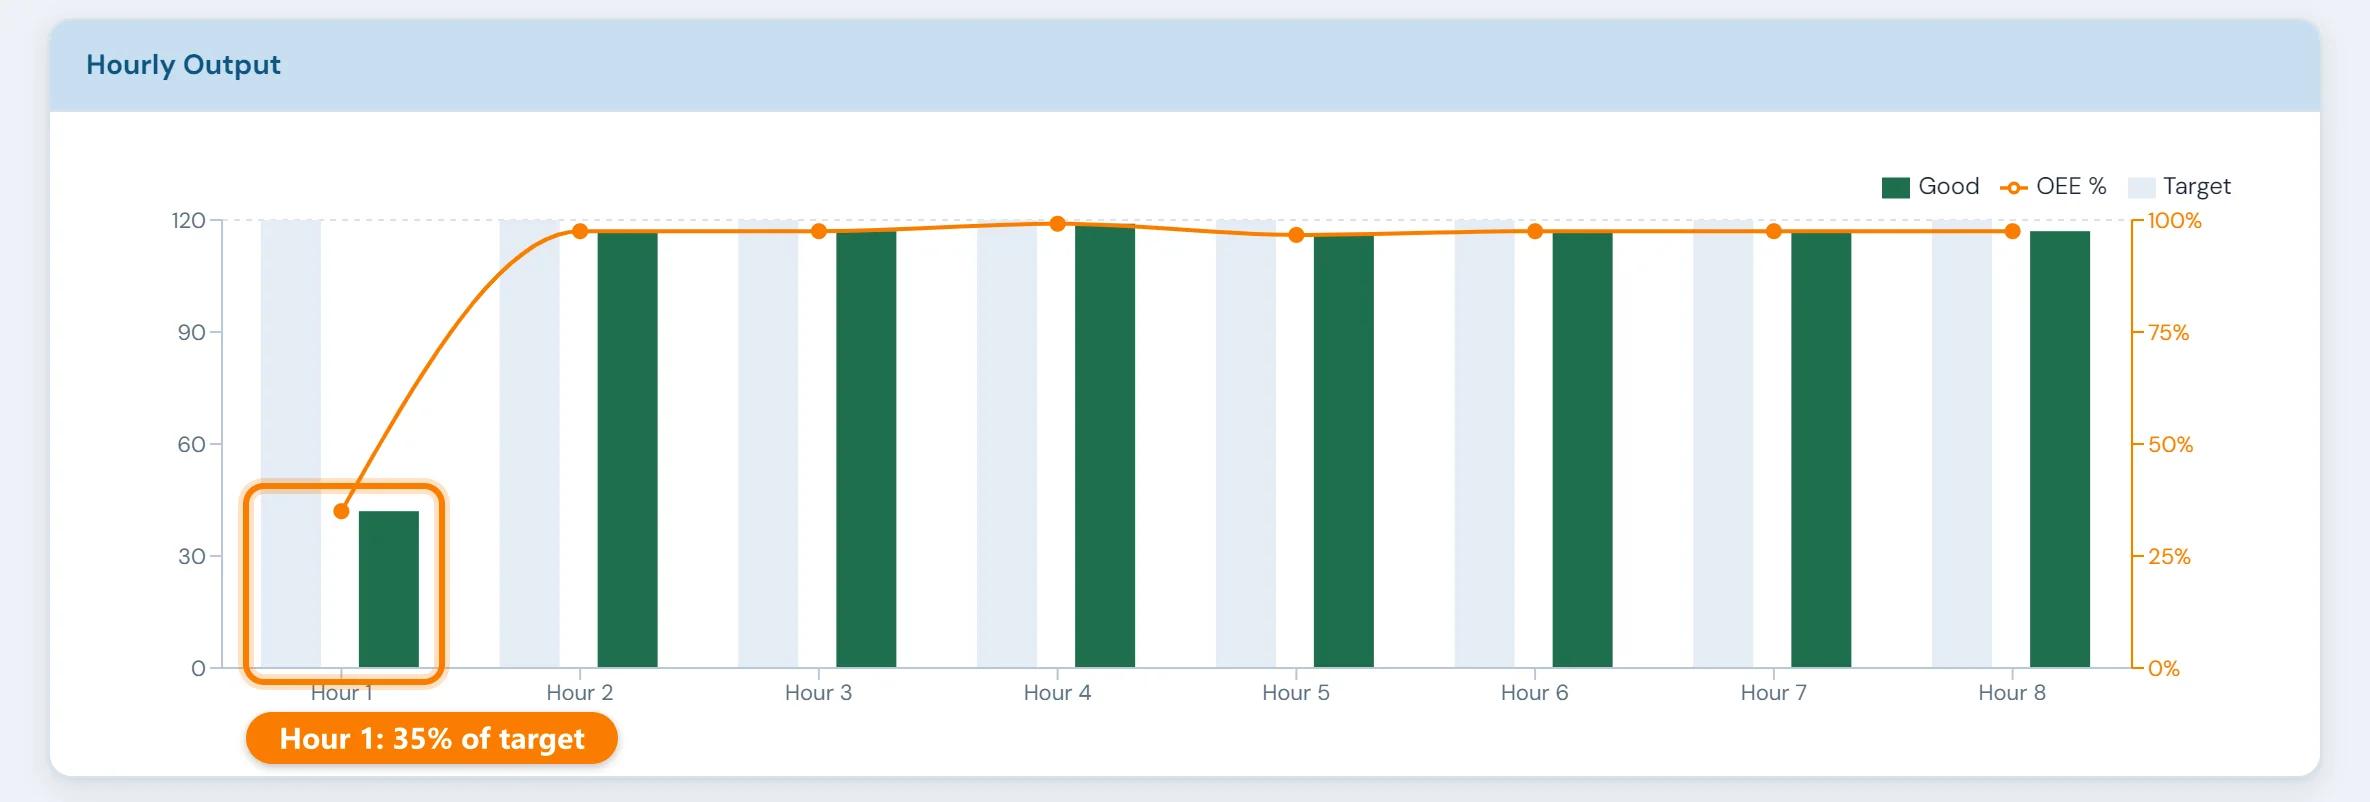
- Output against target, hour by hour. A shift total hides the slow first hour after start-up or the one bad hour after a changeover.
- The top downtime reasons, in minutes. Ranked by minutes lost.
- Scrap by reason. Enough to see whether one defect is growing.
- Open issues and notes. What was handed over and is still unresolved.
- Nothing else. Trends, OEE breakdowns and Pareto analysis belong in the daily and weekly reports, where there is time to act on them.
“The automatically emailed reports are great. I can see all the downtime and quality issues, then review with the leads, so we know what to look into and what to watch for during the shift.”
Which report, for whom, and what it should decide
Shift report
Supervisors and team leads
Output vs target, top stops, scrap, open issues. Decides: what the next shift watches first.
Daily summary
Production and plant managers
All lines at a glance, with drill-down to the machine or part that missed. Decides: where to send people and attention today.
Performance review
Operations, maintenance, engineering, quality
The biggest downtime reasons, OEE trend, scrap trend. Decides: which problems get fixed this week, and who owns them.
Management report
Plant leadership and corporate
KPI trends and the result of last month's fixes. Decides: where improvement money and engineering time go next.
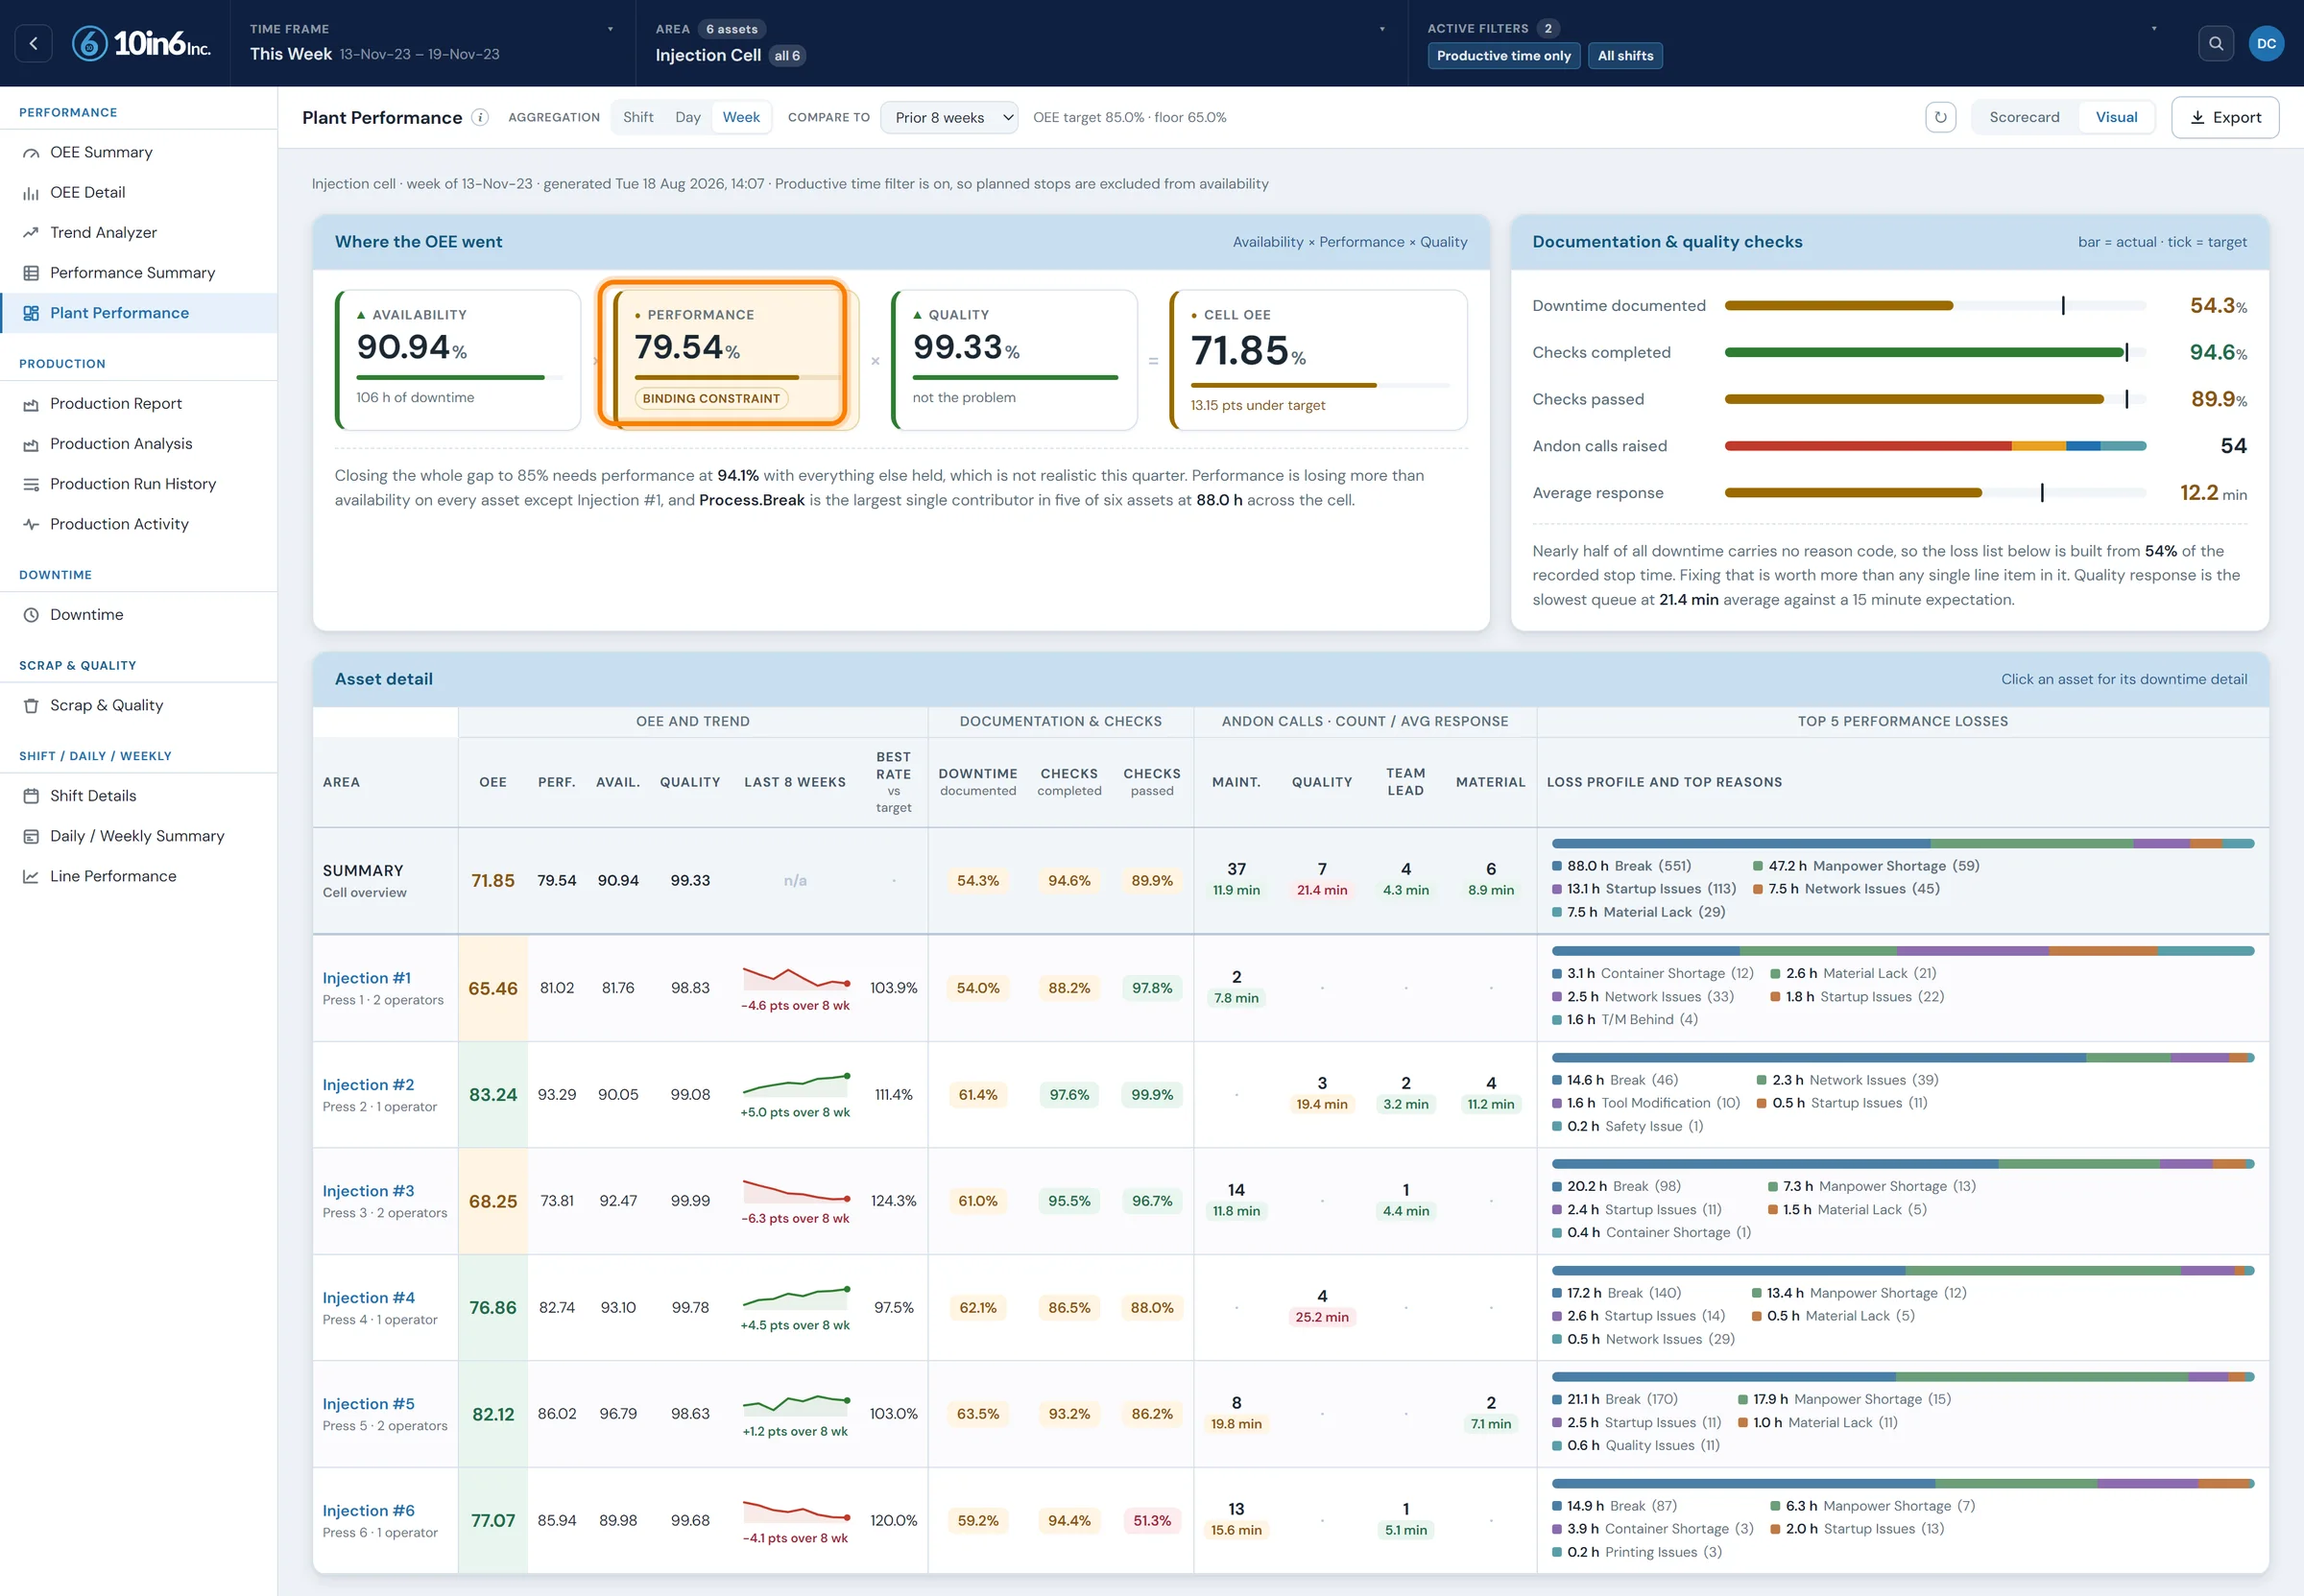
“The automated daily reports show us a 1,000 foot view of production and we can drill down to specifics where needed. Sorting data by shift, day or month for a machine or part number helps us to get to root causes.”
“I use the automated Shift reports everyday. They give me continuous stream of what goes on in the plant and I can quickly see any red flags.”
Four questions to answer first
Are the machines connected?
An automatic report needs counts and stops from the machines. If some aren't connected yet, that comes first. Machines with manual entry can report alongside the connected ones in the meantime.
Is someone building it by hand today?
If so, start from that report. It shows what people already read and which numbers they trust. If nobody builds it yet, the report has to be designed before it can be automated.
What should it tell the team?
Name the decision it supports: which machine maintenance visits first, or whether the line will make the order. Then keep only the numbers that decision needs.
Are these the right numbers?
A plant tracking parts per shift can't see that the shortfall comes from one machine running a second slow on every cycle. When the goal needs a new metric, it may also need a new signal from the machine.
Your analysts work from the same data
Plants usually have a few people who build their own models of cost, capacity or scrap. Their inputs used to be typed in from the shift sheets. Now they come from the same SQL Server database the shift report is built from, and Power BI and other BI tools connect to it directly.
When a report needs to look exactly like the one your meeting already uses, we build it. See Custom Workflows, Reporting & Alerts.
What changed when the reports stopped being built by hand
“The 10in6 system has provided us very accurate and believable information that everyone from the shop floor to the boardroom can agree on.”
Related modules and services
Production reporting questions
- How do you automate production reporting?
- Capture the data at the source instead of typing it in later. Counts, run and stop states and cycle times come from the machines or PLCs; operators add the context a machine cannot know, such as downtime reasons and scrap, at the line while it is happening. The shift report is then generated from that record and emailed to the people who need it when the shift ends, with nobody assembling it by hand.
- Who offers software for automating production reporting?
- Three kinds of vendor: MES providers, where production reporting is one module alongside quality, maintenance and execution; machine-monitoring tools, which report counts and run states but usually little context; and ERP add-ons, which report transactions rather than what happened on each machine. 10in6 is an MES provider. Its production reporting is built from machine data plus operator context, and every deployment is configured to the plant's own shifts, targets and reports by a 10in6 project team.
- What should a shift production report include?
- Output against target, ideally hour by hour so a slow start or a bad hour is visible; the top downtime reasons with minutes lost; scrap by reason; any open issues or notes handed to the next shift; and a one-line summary of what needs attention. Anything the supervisor cannot act on during the next shift is better left to the daily or weekly report.
- Can our team still run its own analysis?
- Yes. All production data sits in a structured SQL Server database your team can query, and BI tools such as Power BI can connect directly. Analysts work from the same machine and operator data the shift report uses, and nobody types the numbers in first.
- What is a production reporting system?
- A production reporting system collects what happened on the plant floor (counts, cycle times, downtime events and their reason codes, scrap and changeovers) and turns it into shift, daily and period reports without anyone re-keying numbers. What sets it apart is where the data comes from: machines, PLCs and operator entry at the moment of the event, so the report reflects the shift itself rather than someone's recollection of it.
- How is a manufacturing reporting system different from ERP reporting?
- ERP reporting answers financial and transactional questions — what was ordered, consumed, and shipped — at the granularity the business needs to close the books. A manufacturing reporting system works at machine and shift granularity: which asset stopped, for how long, why, and what it cost in throughput. A plant usually needs both, so 10in6 integrates with the ERP instead of replacing it, passing production actuals across so the two agree without re-entry.
- Is production reporting software the same as an MES?
- Production reporting is one capability within an MES, not a synonym for it. An MES also governs execution — scheduling, routing, quality gates, traceability, and operator workflow. If your plant's immediate problem is that nobody trusts the shift numbers, production reporting is the part to deploy first; it is also the fastest to show return, because it needs machine connectivity and reporting rather than a change to how the floor is run.
- What reports are available out of the box?
- 10in6 supports a broad range of standard production and performance reports including shift summaries, daily production reporting, OEE-related reporting, downtime analysis, and scrap reporting. Automated delivery is included.
- Can reports be customized to our KPIs?
- Yes. Standard reporting covers common manufacturing needs, and custom reporting can be built when your plant requires a specific KPI view, delivery format, or output that differs from the standard set.
- How does production data get into the reports?
- Counts, run and stop states and cycle times are usually collected automatically from machines, PLCs and connected systems. Operators add what a machine can't know, such as downtime reason codes, scrap counts and shift notes.
- Can reports be scheduled and emailed automatically?
- Yes. Automated delivery is part of the reporting model, so supervisors and managers receive their reports without anyone preparing and sending them at the end of each shift.
- Who uses these reports?
- Operators, supervisors, plant managers and executives, each with a view set to the level of detail they need.
- How does this connect to our ERP?
- Production Reporting works closely with ERP & Business System Integration so production actuals can be shared with the ERP without manual re-entry, depending on the scope of the deployment.
Set up around how your plant runs
Standardized platforms expect the plant to change to fit the software. Do-it-yourself platforms leave your team to build and maintain everything. With 10in6, we configure the system around your equipment, codes and reports, and your team runs it day to day.
Your equipment, codes and reports
Your shift structure, part numbers and targets, and the report your morning meeting runs on, built from live production data.
Your team runs it day to day
Operators, downtime and scrap codes, products and targets, shift schedules, checks, alerts, emailed reports and real-time boards are managed by your own people. Everyday changes need no support ticket and no invoice.
A project manager for the bigger things
New machines, new modules and custom reports go through a 10in6 project manager who already knows your deployment, so nothing starts from scratch. If you would rather we made everyday changes too, we can.
Still here years later
The system keeps being refined after go-live, and new capabilities are added without rebuilding it. Some of our customer relationships have run for 12 years, and 97% of customers say they would never go back.
“[Our 10in6 project manager] is very quick to respond if we have questions or issues. He has helped us get the information we want out of 10in6, sharing standard reports we didn’t know about, or making adjustments when needed.”
How the 10in6 delivery model works →
Stop rebuilding the shift after it ends.
Tell us how your shift reports are put together today. We will show you what they look like when they are built from the machines and delivered automatically, in the format your team already uses.
Free 30–60 minute call with one of our engineers.