
SPC That Catches Process Drift Before It Becomes a Defect
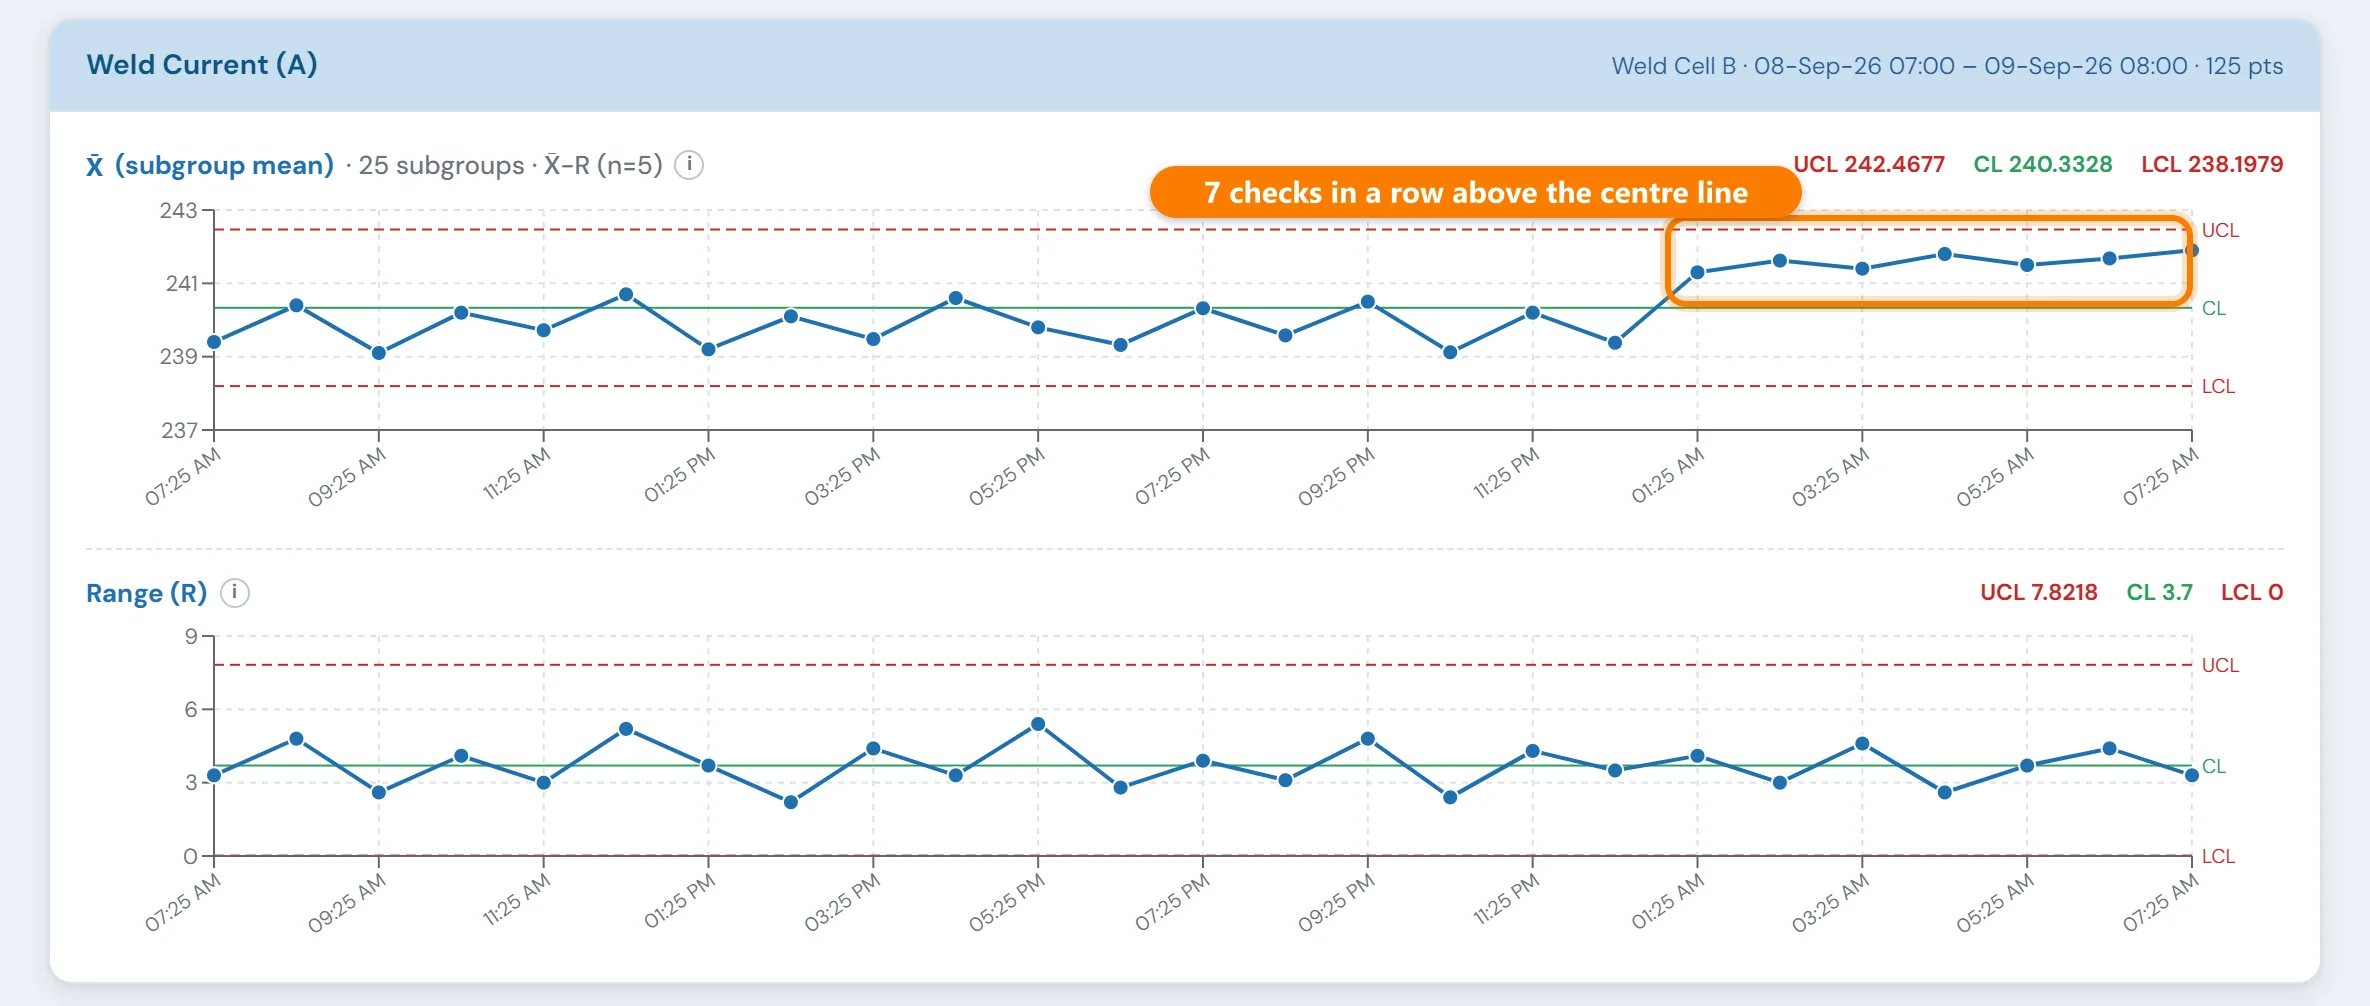
Control charts (Xbar, R, I-MR) and Cpk built into 10in6, plotted as operators enter readings and the PLC reports process values.
A reading taken on Tuesday, charted on Friday
An operator measures a bore every hour and writes the reading on a check sheet. At the end of the week someone in quality types the sheets into a spreadsheet and plots the chart. If the process started drifting on Tuesday, the chart shows it after three more days of parts.
Where a plant does have good SPC software, it often sits outside production. The quality engineer sees the chart; the operator running the machine doesn't.
The standard charts, where the readings are entered
10in6 keeps SPC to the charts a plant uses day to day and leaves specialist statistics to dedicated packages. The charts live where your team already works, so a reading can be seen against its limits as soon as it is entered.
The charts sit in the same system as the operator's checks and the production record. An engineer looking into a signal can see which product was running and who was on shift without opening another file.
Readings reach the charts two ways: operators enter them during scheduled checks at the Operator Console, and process values such as temperatures, pressures and currents are collected automatically from the PLC through Process Variable Collection.
Charts, capability and export
Process capability analysis
Cpk and related views show whether a characteristic is still within its capability limits and whether the margin is shrinking. The glossary explains the difference between Cp, Cpk, Pp and Ppk.
Xbar and R chart monitoring
Subgroup mean and range plotted over time, the standard control chart pair for checks that measure a sample of several parts.
SPC inside the production workflow
The module works with the 10in6 Operator Console, so the charts are built from the readings operators enter at the line.
Export for deeper analysis
For more advanced statistical work, export the data to the SPC package your engineers already use.
Control limits, spec limits and Cpk on one characteristic
A hole position specified at 42.00 mm ± 0.15 mm. Over recent production the process averages 42.04 mm with a standard deviation of 0.03 mm.
Spec limits vs control limits
Spec: 41.85 – 42.15 mm (the drawing)
Control (individuals, ±3σ): 41.95 – 42.13 mm (the process)
A reading of 42.14 mm is inside spec but outside the control limits. No bad part yet, but the process has changed. That is the signal worth acting on.
Capability: Cp and Cpk
Cp = (42.15 − 41.85) ÷ (6 × 0.03) = 1.67
Cpk = (42.15 − 42.04) ÷ (3 × 0.03) = 1.22
The spread would fit comfortably if the process were centred (Cp 1.67), but the mean sits 0.04 mm high, so Cpk is only 1.22, below the common 1.33 minimum. Recentring alone would bring Cpk back to 1.67 without reducing variation at all.
Patterns that signal a change, even inside the limits
Common run rules (the Western Electric rules) flag a process as out of control when any of these happen:
- One point beyond the 3σ control limits.
- Two of three consecutive points beyond 2σ on the same side.
- Four of five consecutive points beyond 1σ on the same side.
- Eight consecutive points on the same side of the centre line.
In practice: SPC fails when charts are plotted by hand at the end of the shift, when every characteristic gets a chart and nobody watches any of them, and when a signal has no reaction plan. Pick the few characteristics that tend to drift, chart them as readings are entered, and decide in advance what the operator does when a point goes out.
Where the readings come from, and where they go
SPC questions
- What is the difference between control limits and specification limits?
- Specification limits come from the customer or the drawing: they say what a good part is. Control limits come from the process itself, usually the mean plus and minus three standard deviations: they say what the process normally does. A part can be inside spec while the process is out of control, which is the early warning SPC exists to give. Drawing spec limits on a control chart and calling them control limits is one of the most common SPC mistakes.
- What is a good Cpk?
- A Cpk of 1.33 is generally accepted as adequate for most discrete manufacturing. 1.67 is the threshold AIAG PPAP requires for significant characteristics on initial process studies, and 2.0 corresponds to a six sigma process. Below 1.0, the process isn't capable of meeting the specification. Cpk is always less than or equal to Cp; the gap between them shows how much capability you'd gain simply by centring the process.
- Which MES software has built-in SPC?
- Look for SPC that sits inside the same system that runs the quality checks, so readings are charted as operators enter them instead of being exported and plotted later. 10in6 includes Xbar, R and I-MR charts and Cpk analysis inside its Digital Quality System, connected to scheduled checks and the Operator Console, with alerts when results go out of range. Data can still be exported to a dedicated statistics package for deeper studies.
- How can manufacturers improve statistical process control with connected quality data?
- Chart readings the moment they are entered rather than at the end of the shift, alert the right people when a point goes out of range, and keep each result tied to its line, product, shift and lot so a signal can be investigated. Limit SPC to the characteristics that actually drift, and give each one a reaction plan. Connected data turns SPC from a compliance chart on a wall into a live early warning.
- What SPC tools are included in 10in6?
- 10in6 includes commonly used SPC tools such as Xbar charts, R charts, I-MR charts, and Cpk analysis.
- Is 10in6 meant to replace advanced SPC software?
- Not necessarily. The module is built for the everyday SPC work done during production: control charts and Cpk on the characteristics you check. When deeper analysis is needed, the data can be exported to your preferred SPC package.
- What kind of data can be analyzed?
- Any numeric characteristic 10in6 records: readings operators enter during scheduled checks, and process values collected automatically from the PLC. Xbar-R, I-MR and capability views work on both, and the data can be exported to an external SPC package for deeper analysis.
- How does SPC connect to the operator workflow?
- The module integrates with the 10in6 Operator Console, making it easier to connect SPC analysis to the production environment rather than treating it as a separate activity.
- Can we export data to our existing SPC package?
- Yes. 10in6 supports exporting data so teams can continue using their preferred advanced SPC analysis tools where needed.
- Who is this useful for?
- SPC is useful for quality teams, engineers, supervisors, and operations leaders who need to monitor process stability and respond before variation becomes a larger quality problem.
Set up around how your plant runs
Standardized platforms expect the plant to change to fit the software. Do-it-yourself platforms leave your team to build and maintain everything. With 10in6, we configure the system around your equipment, codes and reports, and your team runs it day to day.
Your equipment, codes and reports
Your checks, intervals and forms set up per line and product, and traceability built around your part numbers and your customers’ requirements.
Your team runs it day to day
Operators, downtime and scrap codes, products and targets, shift schedules, checks, alerts, emailed reports and real-time boards are managed by your own people. Everyday changes need no support ticket and no invoice.
A project manager for the bigger things
New machines, new modules and custom reports go through a 10in6 project manager who already knows your deployment, so nothing starts from scratch. If you would rather we made everyday changes too, we can.
Still here years later
The system keeps being refined after go-live, and new capabilities are added without rebuilding it. Some of our customer relationships have run for 12 years, and 97% of customers say they would never go back.
“Our 10in6 Project Manager has been very responsive and the software is flexible enough to be configured to our specific needs.”
How the 10in6 delivery model works →
Catch the drift before the scrap.
Tell us which characteristics give you trouble and how they're charted today. We'll show you what live SPC looks like on your lines, tied to your checks and your control plan.
Free 30–60 minute call with one of our engineers.